Thursday, December 31, 2020

Sustainable Software Engineering - Reduce Carbon Footprint


Usually applications are designed focusing on fast performance and low latency. Based on the choices we go for in terms of infrastructure, software, networking  and maintenance of respective operations have an impact on our environment triggering increased Carbon emission.

Sustainable Software Engineering considers the factors of climate science along with Software Design & Architecture, hardware, electricity, and Data Center design as well. Some of the principles of Sustainable Software Engineering that are explained in the link https://docs.microsoft.com/en-us/learn/modules/sustainable-software-engineering-overview/2-overview can be adopted while building the  system more Carbon efficient way.

This blog focuses on Migrating the on-prem servers to (Microsoft Azure) Cloud presenting the opportunity to reduce consumption of energy and related Carbon emissions. Research has demonstrated Microsoft Cloud which has Serverless architecture is more energy efficient than other enterprise datacenters.

Cloud servers are used when they are needed and delimit the usage after the completion of execution which helps sustainability as servers, storage, and network bandwidth are used to their maximum utilization levels.

Understanding how much power is being consumed will help to know how much power the server / application consumes. Microsoft Sustainability Calculator is also being made available for Azure enterprise customers that provides new insight into carbon emissions data associated with the associated Azure services. The calculator gives a granular view of the estimated emissions savings from running workloads on Azure compared to that of a typical on-premises deployment.

With Microsoft’s Azure Kubernetes Service (AKS) offering, the process of developing a serverless application and deploying it with a Continuous Integrated / Delivery experience along with security is simplified. AKS reduces the complexity and operational overhead of managing Kubernetes. As a hosted Kubernetes service, Azure handles health monitoring and maintenance. As Kubernetes masters are managed by Azure, only agent nodes are to be maintained. Overview and key components of AKS are found here - https://docs.microsoft.com/en-us/azure/aks/intro-kubernetes

Azure Monitor provides details on the cluster's  memory and CPU usage which helps to reduce the carbon footprint of the cluster.

Reducing the amount of idle time for compute resources can lower the carbon footprint. Reducing idle time involves increasing the utilization of compute resources – nodes in the cluster. Similarly Sizing the nodes as per workload needs can help run few nodes at higher utilization. Some of the other considerations are configurations to control Cluster scales, usage of spot pools helps to utilize idle capacity within Azure.

Another aspect is to reduce network travel, consider creating clusters in regions closer to the source of the network traffic. Azure Traffic Manager can also be used to help with routing traffic to the closest cluster.

Spot tools can be configured  to change the time or region for a service to run based on the shaping of the demand.

So Let’s build energy efficient applications and move away from On-Prem wherever feasible to reach the goal to become Carbon Negative! 

Saturday, June 20, 2020

Lockdown Extension Sentiment Analysis using Azure Cognitive Services


It's been around 100+ days since the first COVID-19 case in India and 60+ days into the earliest Lockdown Order by our Government. Although people understand that the extension is for their own good and to endanger the dreadly Corona Virus, social media was abuzz with reactions. Extended lockdowns are having disastrous to the economy along with psychological impact on the people. We see shift across the fields like remote learning, work from home, and transformation of business models. In order to ensure the new directions are on right move, data-driven decision making is vital and in this digital world key source of data is social media to gauge public sentiment.

This post elucidates the usage of Azure Cognitive Services Text Analytics API, an Artificial Intelligence & Machine Learning method to perform Sentiment Analysis of large unstructured data.

Case Study - Twitter Sentiment Analysis on Lockdown Extension using Microsoft Stack – Flow, Azure, Cloud, Cognitive Services & Power BI.
  • Extract Twitter feeds into excel using Power Automate
  • Azure Cloud & Cognitive Services to generate the key & end point for Text Analysis API
  • Power BI Desktop to import and transform data
Before getting into nitty gritties of the use case, let’s have a brief of various technical concepts that will be used for implementation.

Sentiment Analysis extracts views either positive, negative or neutral from the given text which can be used for surveys, social media analyses and overview of psychological trends.

Microsoft Azure Cognitive Services is a collection of machine learning and AI algorithms in the cloud for development projects. You don’t have to be a Data Scientist to harness the power of ML. It’s as simple as calling a library, under the hood it does complicated stuff, but from use perspective it just inputs and outputs practically.

The Text Analytics API is a cloud-based service that provides advanced Natural Language Processing over raw text, and includes four main functions: sentiment analysis, key phrase extraction, language detection, and named entity recognition.
The Text Analytics client object authenticates to Azure using a key and provides functions to accept text as single string or a batch and returns a sentiment label and score of the entire input.

Microsoft Power Automate is a service that helps to create automated workflows between the apps and services to synchronize files, get notifications and collect data.

Microsoft Power BI Desktop which is a free application and can be installed on local computer that connects to, transform and visualize the data.

Now let’s start implementing the below flow:


Pre-requisites – Set up the Environment :

Walk-through of the implementation

Step 1 : To extract Twitter feeds into excel using Power Automate, login to Microsoft flow as mentioned in the Pre-requisites.
Create a New Automated flow and select a twitter trigger :


Mention the Search text as “Lockdown extension”. Add a New Step and Choose an action to select Excel that was uploaded in OneDrive, configure the excel / table details as below :


Save and Test the Flow, when refreshed, excel file starts getting filled automatically with the feeds from Twitter that are tagged # Lockdown extension :


Step 2 : To generate the key and endpoint for Azure Cognitive Services Text Analytics API, login to Azure portal.
Create a new resource under Cognitive Services :, Supply the Name, Subscription, Location, Service plan and Resource group


Once Deployment is completed, secure the generated Keys & Endpoint :


Step 3 : Access the Key and Enpoint generated in Step 2 to invoke and apply the function in Power BI Desktop data that was imported from excel tweet file
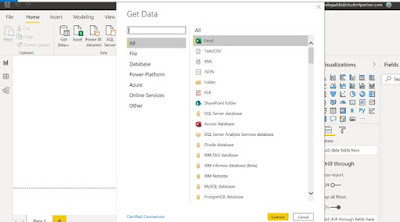
Launch Power BI Desktop and load the Twitter Feed excel file via Get Data :


Select GetData -> Blank Query to build the Custom Function for invoking the Cognitive Services Text Analytics API Key & Endpoint :


The Sentiment Analysis – Text Analytics function above uses a Machine Learning classification returns a score between 0 and 1, where 1 is the most positive indicating how positive the sentiment expressed in the text.
Apply the function on the Twitter Text feed column to obtain Sentiment scores.
A custom column has been added to derive the text (Positive / Negative / Neutral) based on the arrived sentiment score.


Unlike the existing process - collecting data via surveys, summarizing the emotions of people during a specific time interval, this solution depicts the emotions of the live twitter data with higher accuracy presenting the sentiment score which helps to understand people’s sentiment towards the epidemic, government decision to extend the lockdown and also helps businesses to make a 360 degree view for decision making and enablement.

Notice the Low Code pattern here in the entire exercise, we did not get into the details of the AI & ML capabilities of Azure Cognitive Services, or even Text Analytics which are pre-trained that enable to process large amount of data.

Wednesday, May 20, 2020

Exploratory Data Analysis – A Key Step in Machine Learning


The goal of this post is to emphasize the role of Exploratory Data Analysis while solving business problems with Machine Learning and Artificial Intelligence with a detailed case study walkthrough.

A 360° data mindset In this information-driven age, a 360° view has to be taken for the extraordinary volume of data that is being available – historic, current and predictive – so that right data has to be extracted to make better business decisions.

Exploratory Data Analysis (EDA) is an observational approach to understand the characteristics of the data. EDA is essential for a well-defined and structured data science project and it should be performed before any machine learning modelling phase. This helps in Identifying patterns and develop hypotheses.

Case Study : A medium size bikes & cycling accessories manufacturing consultancy is keen on growing the business. We’ll help them analyze their customer and transaction data to optimize marketing strategy.

Preliminary Data Exploration – Identify ways to improve the quality of data

Environment and Code Readiness 
  • Create a Jupyter Notebook hosted on Azure
  • Import pandas package to read and write excel data
  • Import matplotlib & seaborn for data visualization
  • Upload the Customer data into the Azure Notebook path


Let’s put the below analysis into various data quality dimensions in a table


Identify Missing Values


Column can be dropped if no relevance


Gender data to be consistent, should be either Male or Female


Check for validity of transactions data :, product first sold date data type float to be converted into date time format


Follow the above code and output for other data sets

Here is the Data Quality Analysis Summary

Data Exploration, Model Development and Interpretation : Understanding the data distributions, feature engineering, data transformations, modelling, results interpretation and reporting.
Customer Age & Gender Distribution : Female category is more than Male; New customers are recommended between 30 to 60 years old
Calculate the age of the customers from date of birth for plotting the graph

Number of Mass Customers under the Wealth Segment are the highest


New customers are from Manufacturing & Finance industry


Customer cars owned data


Visualizations & Interactive Dashboard : Help us highlight key findings and convey the ideas in a more succinct manner. Below dashboards have been built in Power BI desktop. Walk-through of the building of dashboards in Power BI is out of scope for this blog.


Conclusion, Exploratory Data Analysis is a key process in Machine Learning / Data Science projects. The main pillars of EDA are data cleaning, data preparation, data exploration, and data visualization.

Monday, April 20, 2020

One Stop Shop for Machine Learning - Azure Notebooks (with Python)


The goal of this post is to give a better understanding of what Machine Learning is with a detailed case study walk-through and how we can start learning using Python and Azure Notebooks.

Machine Learning, is a means of building models of data – finding, discovering and creating insights from data. It is a suite of statistical methods that are used in conjunction to either 'predict' or 'fill in' a solution based on known parameters. Machine learning does take a lot of burden off of humans (prone to error) and works through data in an incredibly fast rate to really give an impressive result.

Key Terms that are often used in Machine Learning:
Training & Test Data Split usually at 80% - 20%. The training data is used to make sure the machine recognizes patterns in the data and the test data is used to see how well the machine can predict new answers based on its training.
Sentiment Analysis commonly used in marketing and customer service to answer questions such as "Is a product review positive or negative?" and "How are customers responding to a product release?"
Confusion Matrix also known as an error matrix. The confusion matrix quantifies the number of times each answer was classified correctly or incorrectly.

Typically the ML Process consists of
  • Gathering data from various sources
  • Cleaning data to have homogeneity
  • Selection of right ML algorithm model building
  • Gaining insights from the model’s results
  • Transforming results into visual graphs
Here are some of the Top Big Data Use Cases


Below would be the Approach to solve one of the Business Problem Using Machine Learning – Predictive problem to improve client business value


Here are the detailed steps of the approach


Now let’s talk technical and get our hands dirty with Machine Learning using Python and Azure Notebooks

Azure Notebooks is a cloud-based platform for building and running Jupyter notebooks. Jupyter is an environment based on IPython that facilitates interactive programming and data analysis using Python and other programming languages. Azure Notebooks provide Jupyter as a service for free. Jupyter notebooks are composed of cells to enter text / code / data.

Case Study : Machine Learning to create a model that predicts which passengers survived the Titanic shipwreck

Before getting into walk-through of the model, let’s get acquainted with Key Python Libraries


Let’s start building the project - Hypothesis for the survival on the Titanic which can be determined by various parameters from the data set.

Step 1 : Create an Azure Notebook and Import Titanic Data Set which is publicly available


Step 2 : Import the python libraries – pandas & numpy and open the Titanic dataset in pandas data frame


Step 3 : Data Cleansing – drop the NaNs (Not a Number) and the columns which are not necessary. To avoid complex string manipulations, for the time being let’s ensure data has all numeric values


Step 4 : Train / Test Split – let’s start with 3/4th train and 1/4th test


Step 5 : Setup the model using the class RandomForestClassifier with a Yes/No answer – will a person survive or not


Step 6 : Now let’s check the accuracy of the model along with analysis using confusion/error matrix


Step 7 : Review the important features


Age was the biggest determiner of survival in the Titanic accident, followed by male/female, and then your fare class

That’s great, Jupyter Notebooks are highly interactive, and since they can include executable code, they provide the perfect platform for manipulating data and building predictive models from it. Develop and run code from anywhere with Jupyter notebooks on Azure. Azure Notebooks helps to get started quickly on prototyping, data science and also for academic research.

Sunday, January 19, 2020

MICROSOFT AI GAMING MINI-HACK - 30th JAN 2020 CBIT HYDERABAD

Registration Link bit.ly/MSPAIGAMING

If you are in or around CBIT, come join our AI Gaming Mini-Hack an initiative of Microsoft Student Partners, CBIT Hyderabad

We have partnered up with Microsoft & AI Gaming for this event. We’ll have a walk-through on how to build a game playing bot before entering into the tournament. Accompanied by free food & drinks!


Headed By (& Hosting Dept.) Dr. Swamy Das HOD & Prof, Dept. of CSE

Date & Time 30thJan 2020 12:30 to 16:15 Location Chaitanya Bharathi Institute of Technology, Placement Cell
Maximum Places Available 150

Agenda
  • 12:30 Opening and Sign up at AI Gaming & register for the tournament
  • 13:00 Workshop - Build your game playing bot along with securing Azure & Computer Vision resources
  • 14:00 Snack break (powered by Subway) & Swag distribution
  • 14:15 Coding the Bot
  • 15:15 Enter your Bot into the tournament
  • 16:00 Announcement of  the winner and a closing note

This event is suitable for both beginners & experienced programmers with basic knowledge of Python and preferably an awareness to JSON.

Organizing Committee
Jahnavi, Microsoft Student Partner (MSP) # 6309726067 / jahnavi30nov@gmail.com
Annanya, MSP # 8074431082
Chaitanya, MCA III Yr # 9912654045

Come along to learn and play for an interesting and fun way of getting introduced to Microsoft's AI and Machine Learning Services


P.S. Attendance will be given to the participants


Registration Link bit.ly/MSPAIGAMING